The Great Australian Wealth Divide: 2025 Insights
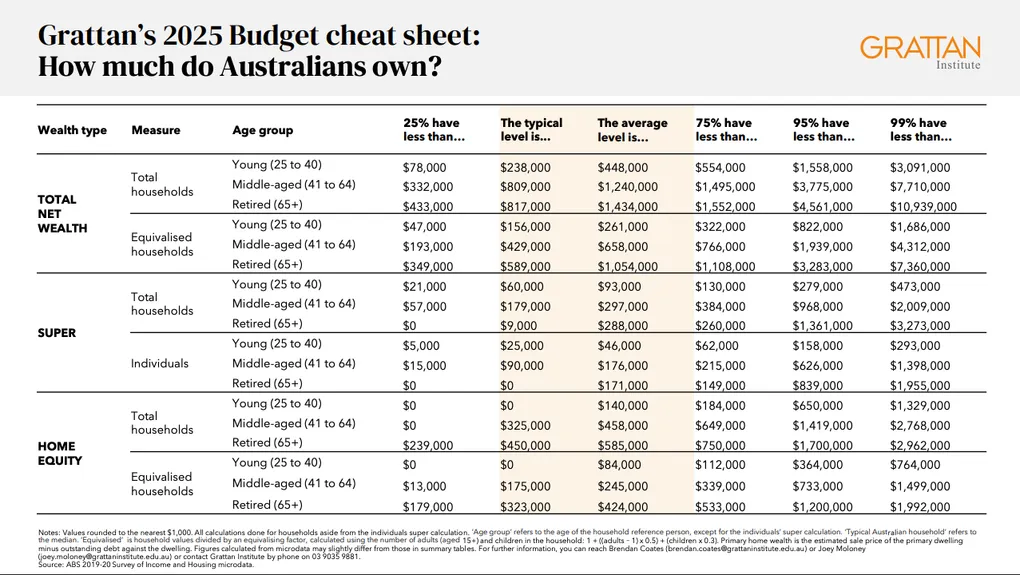
Reference: Grattan Institute’s 2025 “How much do Australians own?” cheat sheet
How much does the “average” Australian actually own? That’s life—and it’s why understanding these benchmarks can be a game changer for your own financial planning.
A lot of people think they are behind, but trust me, nothing beats looking at the hard numbers to keep your mind at ease. It’s not just about money—it’s about knowing where you stand in the system so you can optimize your next move. Bare with me, because this is going to be a bit of a deep dive into the data, but I promise it’s worth it. We’ll break down the numbers by age group and household type, and then we’ll talk about what it all means for you.
“Wealth in Australia is heavily tied to age, with the average household net worth tripling as people move from their 30s into retirement.”
💡 What Makes Up Australian Wealth?
It’s simple: Australian wealth is built on two primary pillars: Superannuation and Home Equity.
- Young Households (25-40): The average net wealth is $448,000. For this group, “Other Assets” (cars, contents, and financial investments) make up nearly half of their net worth.
- Middle-Aged (41-64): Wealth takes a massive leap to an average of $1,240,000. This is where home equity begins to take center stage.
- Retired (65+): Net wealth peaks at $1,434,000, with home equity accounting for over 40% of the total.
🚨 Why Does This Distribution Matter?
- Systems Thinking: Knowing that home equity dominates later life explains why the “Property vs. Shares” debate is so central in Australia.
- Avoid Comparison Traps: There is a huge gap between the Average and the Typical (Median). While the average middle-aged household has $1.24 million, the typical household has $809,000.
- Stay in Control: If you are a breadwinner, seeing how super grows over time highlights the importance of the compounding engine your employer is already funding.
- Huge age group: We have been grouped into 3 periods: Young (25-40), Middle-aged (41-64), and Retired (65+). This is a huge age group, and there are many factors that can influence wealth accumulation within these groups, such as career progression, family size, and financial literacy. So while these numbers give us a general idea of the wealth distribution, they don’t tell the whole story.
📊 Average Wealth Composition by Age group & Household Type
These 2 charts are purely based on the Grattan Institute’s 2025 “How much do Australians own?” cheat sheet.
Calculation of “Other assets”: Total net wealth - superannuation - home equity.
For households:
For Individuals / Equivalised households definition from Grattan: ‘Equivalised’ is household values divided by an equivalising factor, calculated using the number of adults (aged 15+) and children in the household: 1 + ((adults – 1) x 0.5) + (children x 0.3).
🧩 Final Thought
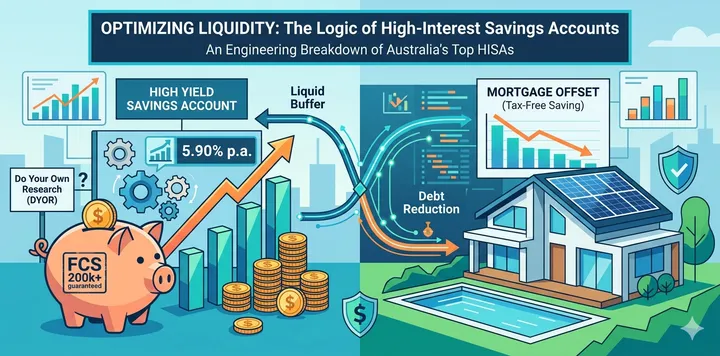
Life is unpredictable, but your financial roadmap doesn’t have to be. The best time to start optimizing your “system” is right now. This is the earliest time you can start, even just planning. If you have no idea how to start, you can start by using a high-interest saving account, pumping your offset account or maximizing super, future you will be glad you did!